Scan signals
Start broad across lead time, failure rate and review load.
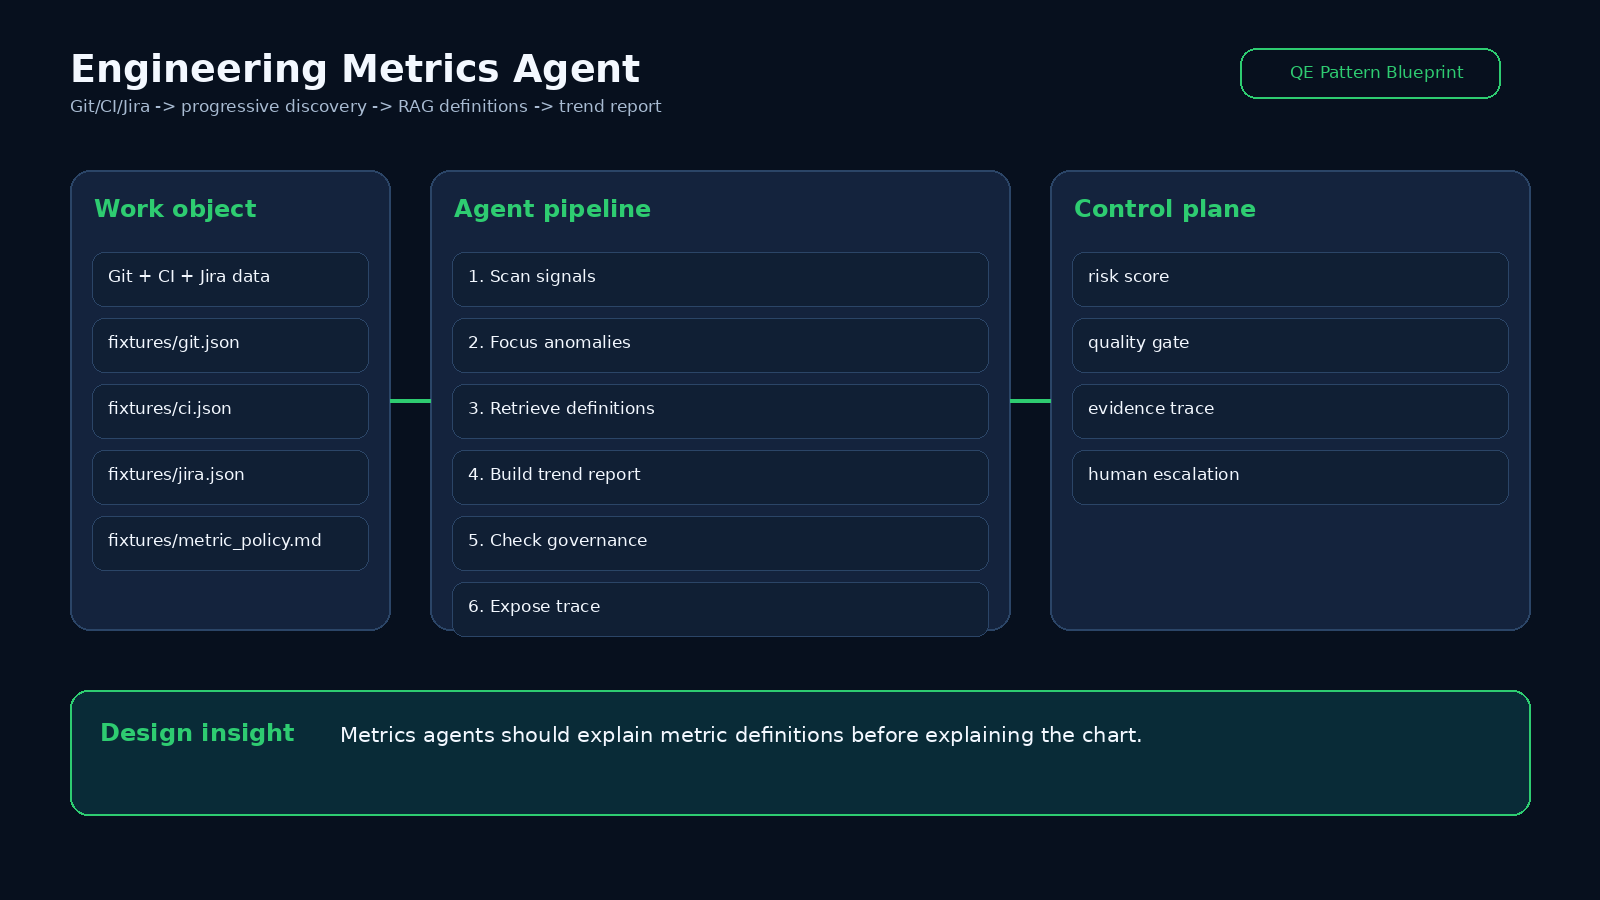
Progressive DiscoveryQuality Engineering Demo
A metrics agent that scans Git, CI and Jira signals, retrieves metric definitions, and writes a source-backed trend report.
Clickable pattern simulator
This simulator does not replace the CLI run, but it makes each step, state, log, gate and final output visible in the browser.
Start broad across lead time, failure rate and review load.
Progressive DiscoveryDrill into metrics whose slope changed.
Progressive DiscoveryBind each metric to the team's agreed definition.
RAG PipelineGenerate trend, interpretation and likely cause.
Prompt ChainingFlag metrics that could be misused or lack source coverage.
Approval GateShow source rows, definition, slope and confidence.
Observability Harness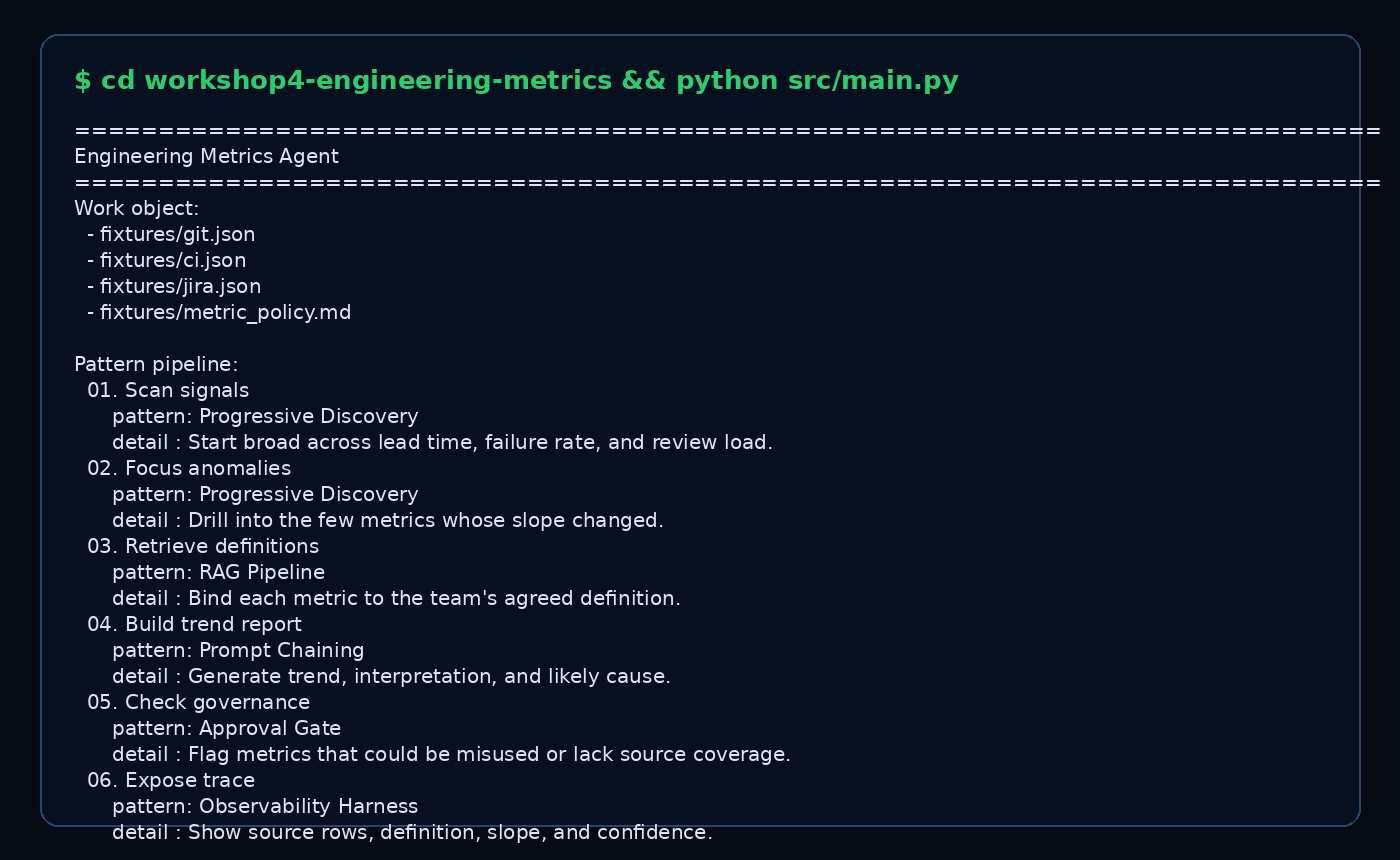
| Pattern | Design role |
|---|---|
| Progressive Discovery | Do not load every metric; forage, focus, then drill. |
| RAG Pipeline | Metric definitions need source-backed retrieval. |
| Observability Harness | Trend, source coverage and confidence are part of the product. |
| Approval Gate | Potentially misleading metrics should be flagged before publication. |
The agent should explain what a metric means before explaining why it moved.
A week-over-week slope catches quality drift earlier than a static threshold.
A report should warn when a metric can be gamed or lacks source coverage.
cd workshops/workshop4-engineering-metrics
python3 -m venv .venv
source .venv/bin/activate
pip install -r requirements.txt
python src/main.py
open visual/index.htmlworkshops/workshop4-engineering-metrics/README.mdimages/training/visual/workshop4-engineering-metrics-blueprint.png